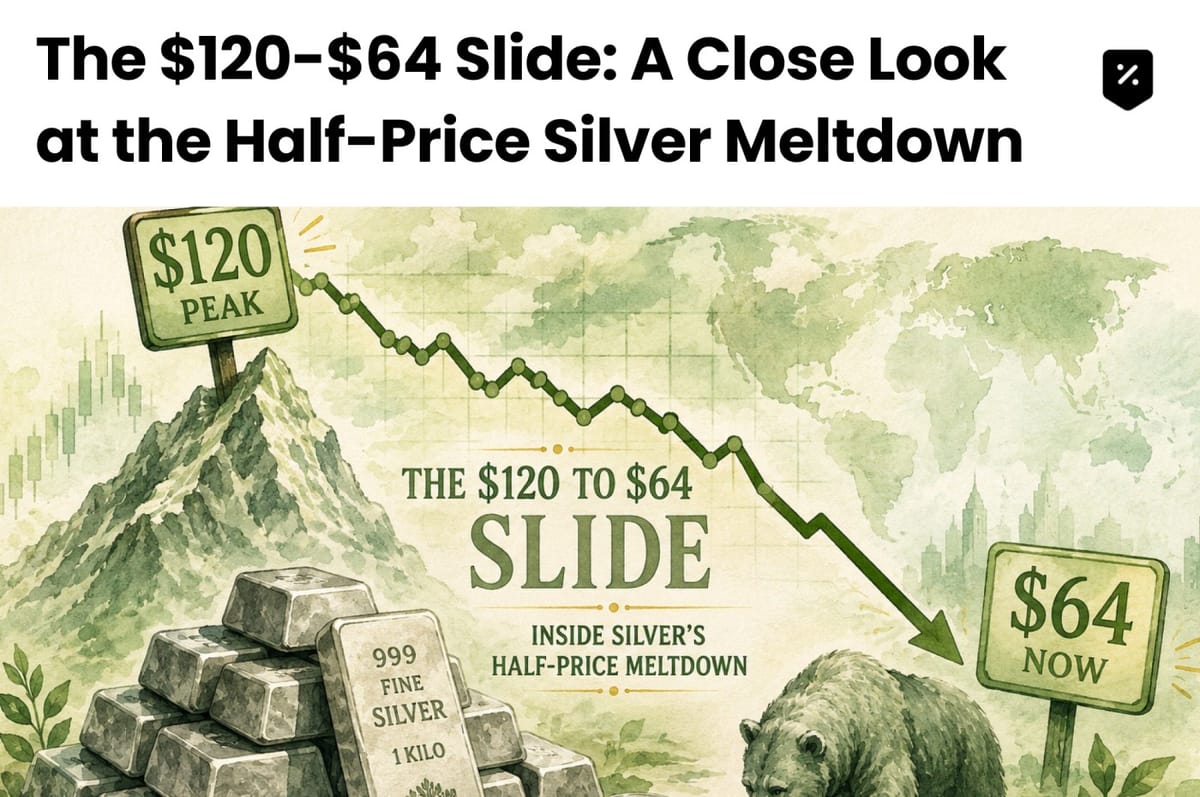
The $120-$64 Slide: A Close Look at the Half-Price Silver Meltdown
The past week's commodities board might have looked like it was reporting typo-ridden precious metal prices.
A few months ago, in late January, silver was the king macro asset, having executed an almost unfathomable 130% surge in the previous year to reach a global high of $121.64 an ounce and then trading towards a record Indian MCX rate of 4,10,000 per kilogram. Then the trapdoor opened.
Last week, silver decisively sliced through its 200-day exponential moving average (200 EMA), a key support level for bulls, falling to $64.50 per ounce and then down to 2,50,000 per kilogram on Indian spot prices, a 10,000-point plunge in one trading day.
Silver has fallen almost 45% in value in just under five months. Mainstream analysts dismiss this as standard profit-taking or a reaction to a red-hot US jobs report on June 6. However, a drop of this magnitude requires examining the mechanics of its fall.
In this edition, we’ll analyse:
- The $100 Crude Effect: How energy prices and persistent Federal Reserve policies altered the currency carry trade.
- The CME Margin Squeeze: A change in exchange rules that pushed institutional traders to liquidate contracts.
- The Indian Bullion Vault Dislocation: Why domestic spot silver prices are declining more rapidly than global benchmarks.
- The Supply Deficit Reality: The underlying data that suggest this drop is a technical phenomenon rather than a structural one.
Segment 1: The Federal Reserve's Sticky Inflation Wall
The most fundamental macro event that triggered this sell-off is the dramatic re-pricing of global interest rates. The persistently high crude oil prices ($100+ per barrel), persistent core inflation, and surprisingly strong US job numbers released June 6 have convinced markets that the Federal Reserve will not cut rates anytime soon. The CME FedWatch tool currently estimates a more than 70% chance of a rate hike by December.
This macro realisation set off a swift and structural domino effect:
- Dollar Strength: The surge in the Dollar Index instantly suppressed dollar-denominated non-yielding assets. Historically, each 1-point rise in the dollar index has shaved about 1%-2% off the spot price of silver.
- Yield Shift: Rising US Treasury yields drew billions in speculative silver positions back into safer, yield-bearing debt instruments.
Segment 2: The Mechanical Margin Cascade
Once a metal declines by 6% in a week and another 10% the week before, human psychology gives way to algorithms.
As silver prices broke through the critical $67 per ounce level, the Chicago Mercantile Exchange (CME) enacted a series of drastic margin increases. The cash needed to maintain a long leveraged position jumped dramatically overnight.
Hedge funds that had benefited from silver's rally from 2025 were suddenly over-leveraged. Unable or unwilling to post the millions required to hold their positions, their contracts were liquidated by automated risk desks. To protect their capital, these same desks immediately dumped their highly liquid gold holdings, causing gold to drop 2.3% to 1,48,955 per 10 grams on the MCX as well.
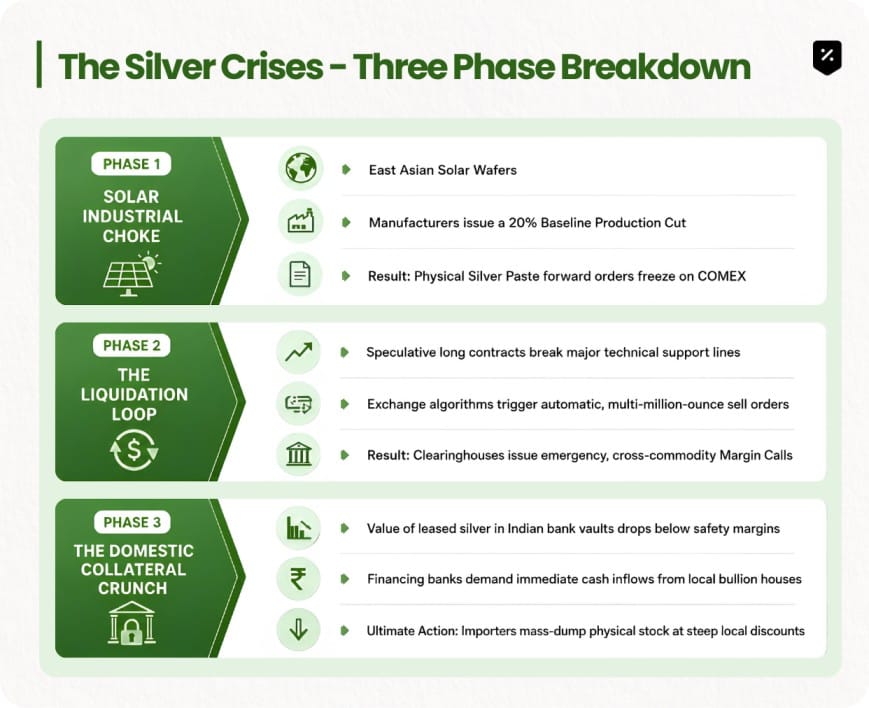
Segment 3: The Indian Bullion Vault Trap
The localized drop in India was further intensified by a supply-side issue.
Throughout 2025, while Indian spot silver prices soared from an average of 95,700 per kilogram to 2,62,000 per kilogram, local bullion houses and importers aggressively built up their inventories using bank credit and metal leasing lines, anticipating a massive retail uptake in anticipation of the festive and wedding seasons.
When global spot silver prices dipped below $65 an ounce, the value of the silver in Indian bank vaults dropped below collateral thresholds. Local banks issued immediate margin calls to importers. To cover the deficit and raise liquidity quickly, these importers dumped their physical bars into the domestic market at heavily discounted rates, driving local spot prices down to 2,50,000 per kilogram.
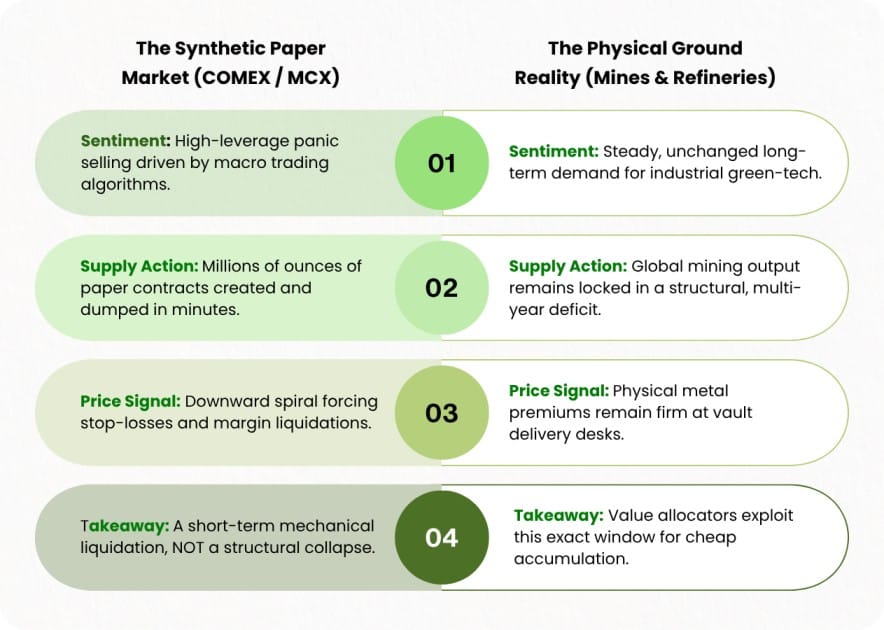
Conclusion
A broken chart is not an indictment of the long-term investment thesis. The current sell-off is a classic and sharp clearinghouse event designed to eliminate speculative leverage from silver's record 130% run. For short-term traders seeking momentum, the technical chart is screaming caution, with analysts forecasting further declines toward the $55 and $46 intermediate support levels. However, for long-term wealth allocators, this 44% price drop significantly alters the valuation landscape. The physical deficit has not vanished-it has merely been temporarily obscured by a stronger dollar and forced institutional selling. The speculative bubble has burst, and the unexciting industrial reality of silver is becoming accessible again at an attractive price.