Is It Time to Swap Your Silver For Gold?
Introduction: The Great Bullion Divergence
For the seasoned Indian investor, the last twelve months have felt like a gold rush, except the gold was white. While equity markets have faced a muted phase, with the Nifty 50 delivering a modest 10.5% return in 2025, the commodities desk has been on fire. We are currently standing at a historic crossroads.
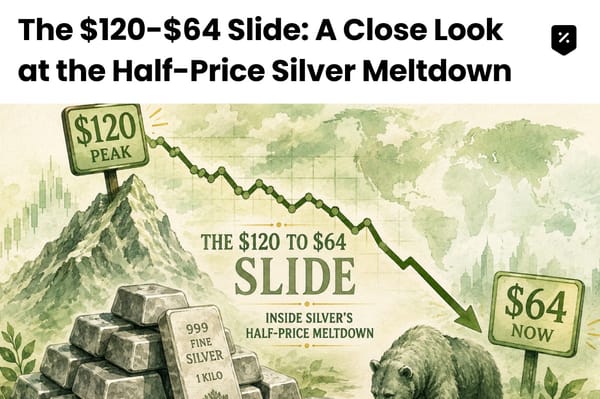
As of March 13, 2026, the price of silver has not just outperformed gold; it has fundamentally re-rated the expectations of what a precious metal can do. But with silver prices in India nearly tripling in rupee terms over the last 14 months, climbing from ₹80,000/kg in early 2025 to a staggering peak of over ₹2.80 lakh/kg, the question on every professional desk from Mumbai to London is the same: Has the spring been coiled too tight?
In this edition, we’ll talk about:
- The 138% Momentum: A post-mortem of the industrial and speculative surge that redefined Silver's price floor.
- The 56.4 Verdict: Decoding the math behind the Gold-Silver Ratio and why this specific number is a historical red zone.
- Central Bank Manoeuvres: Why the world’s biggest institutions are quietly stacking Gold while retail chases Silver.
The answer lies in a single number: 56.4. This is the current Gold-Silver Ratio (GSR), and it represents a verdict on the relative value of these two assets. Today’s deep dive is a factual, data-backed investigation into whether you should harvest your silver gains and rotate into the stability of gold
Section 1: The Anatomy of the 138% Silver Rally
Before we analyze the rotation, we must respect the rally. Silver’s performance in 2025 and early 2026 was not a fluke or a speculative bubble; it was the result of a structural supply-demand collision that the world has not seen in decades.
The Industrial Squeeze
Unlike gold, which is primarily a monetary asset (central banks hold it to protect against currency collapse), silver is a "bi-polar" metal. It is half-currency and half-industrial-fuel. In 2025, the industrial half took over.
- Solar Photovoltaics (PV): Global solar installations reached 655 GW in 2025. Even as manufacturers thrift (using less silver per panel), the sheer volume of global deployment meant that the PV sector consumed nearly 29% of the total annual global silver supply.
- The EV Transition: An average Electric Vehicle (EV) uses 25-50 grams of silver, roughly 70% more than a traditional petrol car. By early 2026, the global shift to EVs moved from a luxury trend to a mass-market mandate, further draining warehouse inventories.
- AI Data Centers: This was the "X-factor" of 2025. High-performance AI hardware requires massive electrical conductivity and thermal management. Silver, being the most conductive metal on earth, became a strategic requirement for the chips and cooling systems powering the AI revolution.
The Supply Deficit
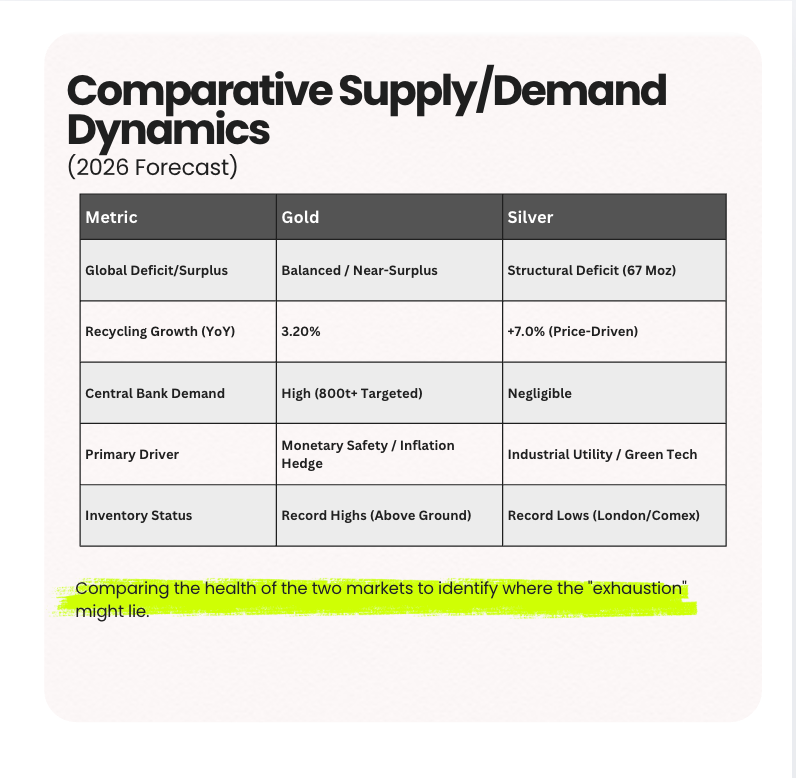
The data from the Silver Institute confirms that we are entering our sixth consecutive year of structural deficit in 2026. Global mine supply is projected to rise by only 1% to 820 million ounces, while total demand continues to outpace production by nearly 67 million ounces.
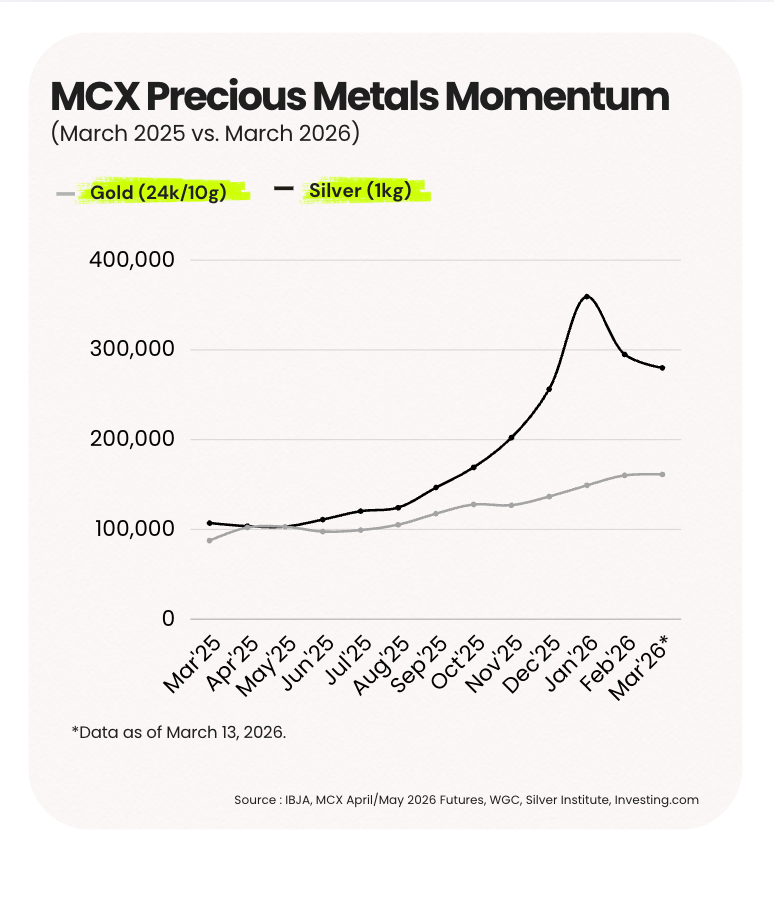
While gold has more than doubled in price, an incredible feat for a safe-haven asset, silver has nearly quadrupled. This is a classic blow-off top momentum profile that typically precedes a sector rotation.
Section 2: Understanding the "56.4 Verdict"
The Gold-Silver Ratio (GSR) is the oldest indicator in the book. It tells you how many kilograms of silver you need to buy 10 grams of gold (or in international terms, how many ounces of silver for one ounce of gold).
The Historical Pivot Points
Historically, the GSR has a pendulum effect:
- The 80+ Signal: When the ratio goes above 80, silver is considered dirt cheap compared to gold. This happened in early 2020 (ratio hit 124) and again in early 2024.
- The 50–60 Signal: When the ratio falls below 60, silver is considered expensive or over-extended.
The Current Reading
As of March 13, 2026, with Gold at approximately ₹1,62,220 and Silver at ₹2,80,000, the ratio is sitting at 56.4. This level hasn't been sustained for long periods in the last 15 years. It suggests that silver's price has run far ahead of its traditional relationship with gold.
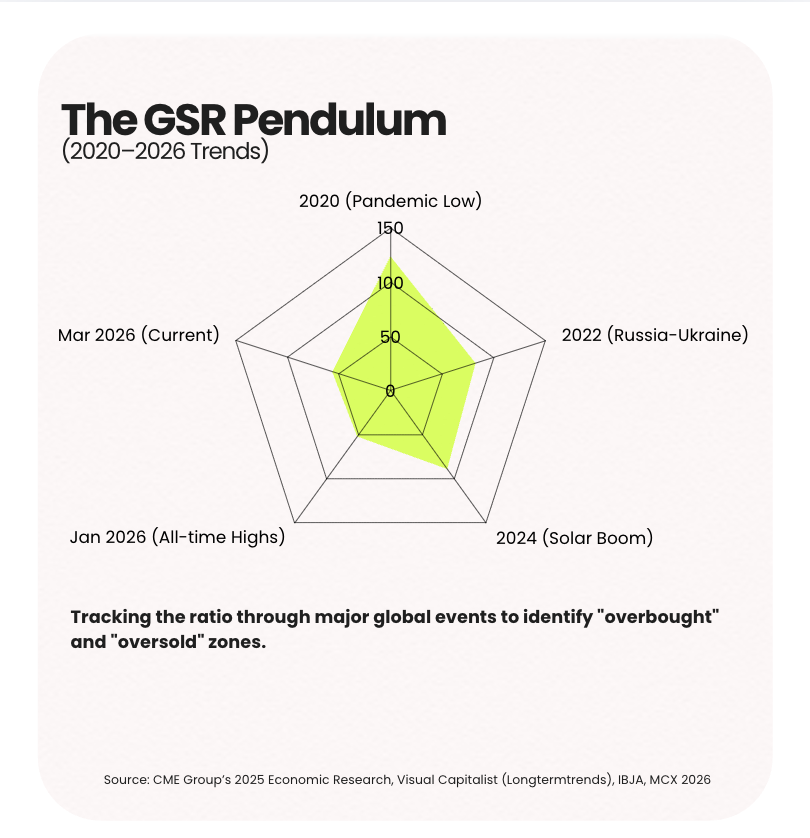
The Verdict Zone of 56.4 represents a statistical anomaly. In the modern free-market era, whenever the ratio stays below 60 for more than a few months, it eventually mean-reverts (rises) back toward 70-75. This can happen in two ways: Gold rises faster than Silver, or Silver corrects while Gold stays flat.
Section 3: The Case for Gold
While silver has been the growth play, gold is currently building a massive fundamental floor. Several data points suggest that gold's quiet rally is actually more sustainable for the next 18 months.
1. Central Bank Aggression
According to the World Gold Council, central banks bought 863 tonnes of gold in 2025. While this was a slight dip from 2024, it remains historically massive. More importantly, gold has recently overtaken US Treasuries as the world's largest reserve asset by value. Central banks like the National Bank of Poland and the Czech National Bank are on record aiming for even higher targets in 2026.
2. The Geopolitical Insurance
The current "Middle East Energy Shock" of March 2026, including tensions surrounding US-Iran-Israel, has driven crude oil prices higher. Historically, gold has a 0.82 correlation with oil price spikes during times of war, as it is seen as the ultimate crisis currency.
3. India's Digital Gold Revolution
Data from AMFI for January 2026 shows a tectonic shift. For the first time, Gold ETFs in India attracted more monthly inflows (₹24,040 Crore) than equity mutual funds (₹24,029 Crore). Indian households are no longer just buying jewelry; they are using gold as a tactical financial instrument.
Section 4: Silver’s Profile for 2026
Investors must realize that silver’s 138% rally has come with 3x the volatility of gold.
The Recycling Threat
At ₹2.80 lakh/kg, silver recycling has become highly profitable. For the first time since 2012, silver recycling supply is projected to exceed 200 million ounces in 2026. This scrap supply acts as a natural brake on further price explosions.
The Thrifting Factor
While solar demand is high, the high price of silver is forcing manufacturers to innovate. New N-type solar cells are using significantly less silver paste than older models. If the price stays above $80/oz (International) or ₹2.80 lakh (Domestic) for too long, the industrial sector will find ways to design silver out of the product.
Factual Insight: Silver has the better "scarcity" story, but gold has the better "institutional backing." When a market is as tight as silver's is now, any small drop in industrial demand (due to a global slowdown) can cause a violent price correction. Gold, backed by central banks, doesn't have that "cliff-edge" risk.
The 56.4 Verdict isn't just a number; it's a call to action. If you have been holding silver throughout this rally, your portfolio is likely over-weighted in the white metal. If your precious metal allocation was originally 50% Gold and 50% Silver, the rally has likely pushed your current split to 25% Gold and 75% Silver. This leaves you vulnerable to a 20-30% silver correction.
The data is clear. Silver’s industrial story is far from over, the solar and EV demand will persist for a decade. However, markets do not move in straight lines. After a 278% gain in a year, the 56.4 Verdict tells us that the risk-to-reward ratio has shifted.
Gold is currently the under-loved asset in the precious metals space. With central banks buying at record clips and Indian retail investors flooding into ETFs, the foundation for a Gold breakout is stronger than ever.
The Verdict: Do not wait for a silver crash to act. Use the current 56.4 ratio as a gift. It is time to harvest the "white" profits and seek shelter in the yellow safety.
Disclaimer: This newsletter is for informational purposes only. Commodities are subject to high market risk. Please consult with your financial advisor before making significant portfolio rotations.