Are We Trading Our Safety Net For A Lifestyle?

What lifebuoy did for hygiene and “Amul” did for the Indian breakfast, “Fixed Deposits” did for the Indian psyche. For half a century, the FD wasn’t just a financial product; it was a cultural anchor. It represented the ultimate Indian virtue: Austerity. We were a nation that saved first and breathed second.
But look around you in 2026. The queues aren’t at the bank’s FD counter; they are at the iPhone pre-order desk, the artisanal cafes of South Delhi, luxury SUV showrooms in Gurgaon, and the check-in counters for “revenge travel” to Dubai.
Something fundamental has cracked. We are witnessing the “Westernisation” of the Indian balance sheet. We are sprinting towards a “High Income, Low Savings” model, a transition that took the US and Europe decades, but which India is attempting in a single generation.
In this newsletter, we’ll cover:
- The death of the Miserly Indian: How our relationship with money changed over the years.
- The Great Divergence: Why assets are at an all-time highs while savings are at all-time lows.
- THe EMI-fication of life: The explosion of unsecured credit and the “Buy Now Pay Later” trap.
- The Risk: Can a low-savings economy fuel a “Viksit Bharat” ambition?
- The RESCUE Framework: How to build wealth without losing your safety net.
Saving for a Rainy Day to Spending for a Sunny One
For decades, the Indian household was the economy’s ultimate fortress. Even when the government ran deficits and corporations struggled, the household saved. We were the world’s “Internal Creditors”.
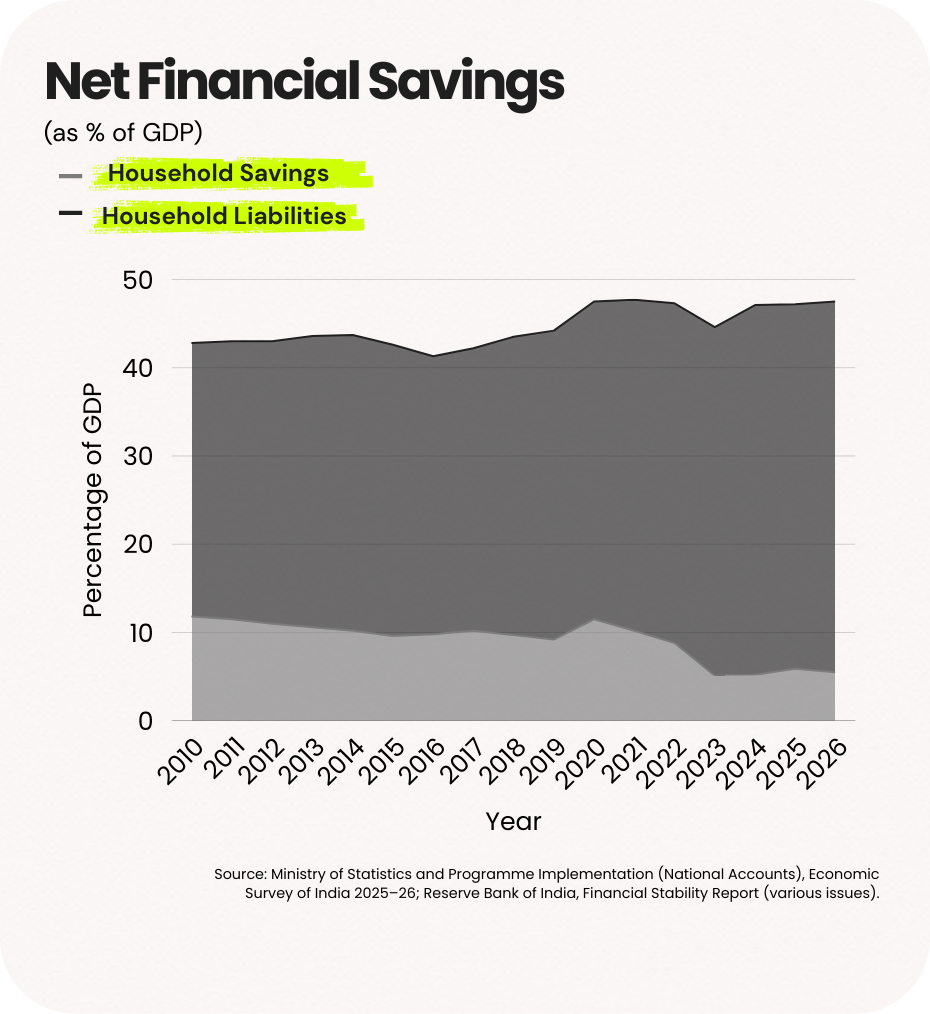
In the early 2000s, net financial savings for Indian households comfortably sat around 10-12% of GDP. Gross domestic savings frequently exceeded 33 percent of GDP. This enabled high investment rates, lower dependence on foreign capital and macroeconomic stability during global shocks.
The pandemic briefly elevated household savings to approximately 11.5 percent of GDP in FY21. However, this was not structural prudence. It was forced savings due to restricted consumption opportunities.
Fast forward to 2026, and the data from the RBI and the Economic Survey of 2025-26 reveals a sobering reality:
- Net Financial Savings: Hovering at a historic low of 5.3% of GDP. This represents one of the lowest readings in several decades. In absolute terms, it means households are saving roughly half as much, relative to the size of the economy, compared to historical norms.
- Household Liabilities: Surged to 6.6% of GDP, Household debt as a percentage of GDP has crossed 40 percent and continues to rise. While India remains below advanced economies in total leverage ratios, the pace of increase is significant. Over the past five years, liabilities have grown substantially faster than financial assets.
- Consumption: Now accounts for a staggering 61.5% of our GDP. The earlier model relied on accumulated savings. The current model increasingly relies on credit expansion.
India still remains below advanced economies such as the United States, where household debt exceeds 70 percent of GDP. However, the velocity of change in India is far higher.
Austerity to Aspiration Pipeline
Why did this happen? It’s not just “greed”. It is a structural evolution.
- The Demographic Dividend: 65% of India is under 35. This generation didn’t grow up in the “scarcity era” (pre-1991). They grew up in the “Abundance Era”. To them, a credit limit isn’t a debt; it’s an extension of their salary. Their financial decision making is shaped by:
- Instant credit access
- Visible consumption benchmarks through social media
- High exposure to equity markets
- Risk tolerance is structurally higher.
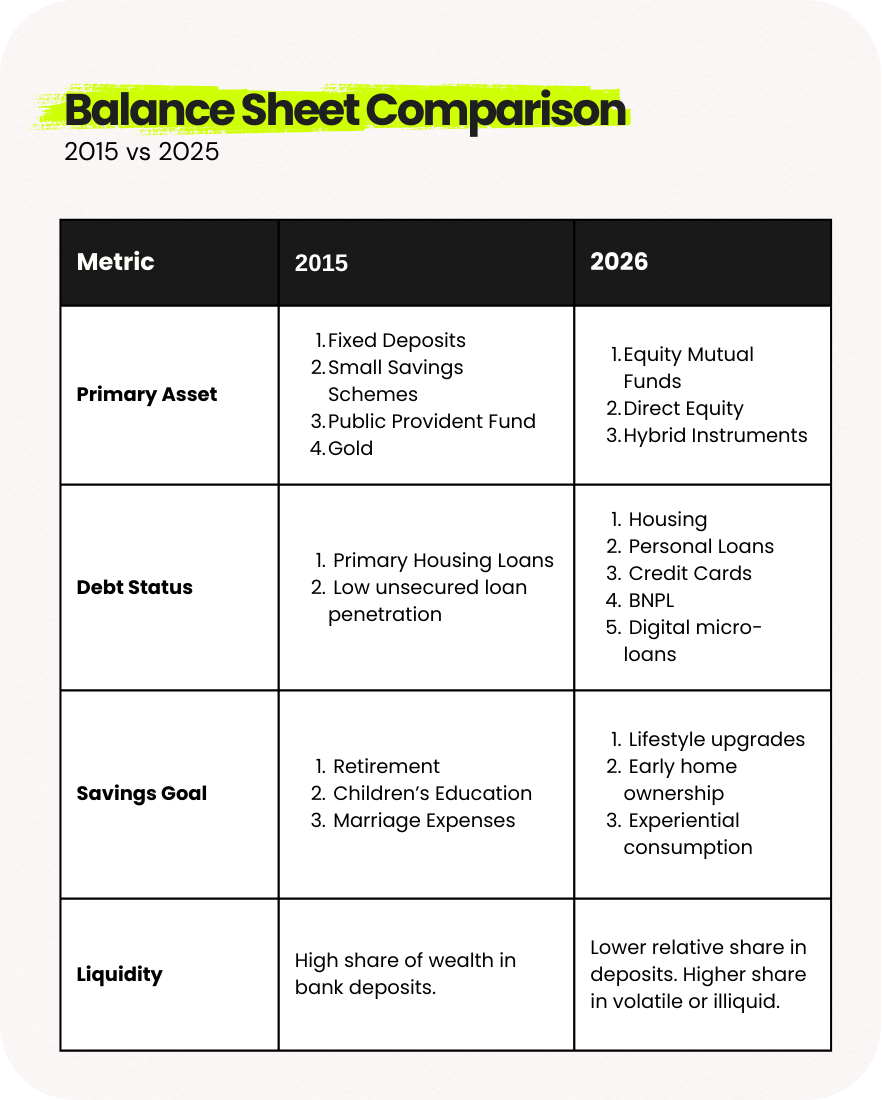
- Financialisation of Household Portfolios:
The number of demat accounts has crossed 150 million. SIP inflows consistently exceed ₹15,000 crore per month. Mutual fund folios have grown steadily.
This reflects capital market deepening. However, portfolio allocation has shifted:
- Declining incremental share of bank deposits
- Higher allocation to equity mutual funds
- Increased exposure to market-linked products
Market participation increases return potential but reduces capital certainty.
When households substitute guaranteed instruments with volatile ones without maintaining liquidity buffers, risk concentration increases.
- Asset Inflation and the Wealth Effect:
Your 2BHK in Gurgaon has doubled in price. Your mutual fund portfolio is up 40%. When people feel wealthy because their assets are growing, they feel less need to save “cash” (the liquid savings).
However:
- Real Estate is Illiquid
- Equity portfolios fluctuate.
- Retirement-linked funds are locked.
Wealth perception does not equal liquidity availability.
- Payment Infrastructure and Spending Friction Collapse:
From UPI enabled panipuri stalls to 10-minute grocery delivery, the “pain of paying” has been digitized away, it has never been easier to part with your money. The psychological friction that previously accompanied cash withdrawals or cheque issuance has been removed.
Digital convenience reduces cognitive pause.
Simultaneously:
- Loan underwriting has become algorithmic.
- Personal loans are approved within minutes.
- Credit card issuance has expanded aggressively in semi-urban markets.
The ease of borrowing changes the baseline consumption pattern.
The Great Divergence
The “puzzle” isn’t that Indians are earning less. On the contrary, the per-capita income is rising at a healthy clip. The puzzle is that our Liabilities (Debt) are growing faster than our financial assets.
The EMI-fication of the Indian Soul
The engine behind this shift is the massive expansion of the retail credit infrastructure. Credit is no longer a last resort; it is a lifestyle enabler.
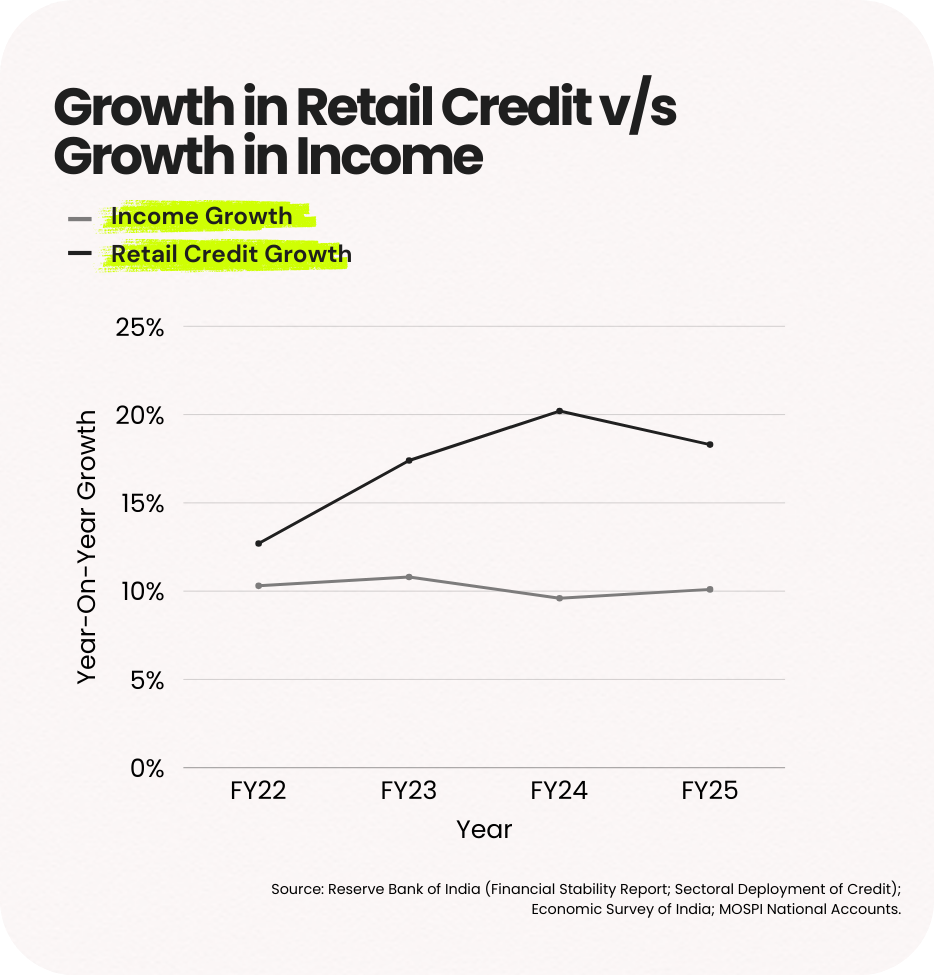
- Unsecured Growth: Personal loans and credit card outstandings have grown at a CAGR of 24% over the last 3 years, outpacing salary growth (approx 9-10%) by a massive margin. We are consuming tomorrow’s income today.
Housing loans remain the largest category in absolute terms. However, incremental growth has increasingly come from unsecured categories.
Unsecured lending includes:
- Personal loans
- Credit card receivables
- Small digital ticket loans
- BNPL
Unsecured credit carries higher interest rates and shorter tenures. This increases rollover risk.
- The “Buy Now, Pay Later” (BNPL) Trap: In 2016, credit was for big-ticket items like homes. In 2026, we are financing sneakers, Zomato orders, and "Insta-worthy" vacations.
The behavioural shift is significant:
Earlier:
Credit was associated with major life events.
Now:
Credit finances recurring lifestyle expenditure.
- The Mortgage Pivot: While physical asset creation is “good debt”, it has sucked the liquidity out of the system. The average age of a first-time homebuyer has dropped from 39 in 2010 to 28 in 2026.
Earlier entry into long-tenure mortgages means:
- Extended EMI duration
- Reduced mobility
- Lower ability to take career risk
Can Low Savings Support High Ambition?
India’s long-term development goals require sustained capital formation. Infrastructure expansion, manufacturing scale-up, and technological investment depend on stable funding.
Domestic savings are a key component of that funding structure. When household savings decline, two consequences follow. First, the government and corporate sectors may rely more heavily on institutional investors and foreign capital. Second, interest rate sensitivity increases because domestic liquidity buffers weaken.
India historically benefited from a strong household savings base that cushioned external shocks. During periods of global volatility, domestic savings reduced the need for abrupt external adjustments.
If net household financial savings remain structurally compressed, macro resilience declines. This does not imply an imminent crisis. It implies reduced margin for error.
Advanced economies transitioned to lower savings rates after achieving high per capita income levels and mature social safety nets. India is transitioning at a middle-income stage with uneven income security.
Stress Scenario Analysis
To understand the practical implications, consider a moderate stress scenario.
Equity markets decline by 20 percent. Urban employment slows. Real estate transactions weaken. Credit standards tighten. In such a scenario, households with high EMIs relative to income and limited emergency buffers would face immediate strain. If a large portion of net worth is concentrated in volatile assets, liquidation during a downturn would crystallise losses.
If multiple households simultaneously reduce consumption to service debt, aggregate demand slows. Slower demand affects corporate earnings, reinforcing the downturn. Credit quality weakens. Financial institutions tighten further.
This feedback loop is manageable when leverage levels are moderate and savings buffers exist. It becomes destabilising when leverage is elevated and liquidity is thin.
The risk is not visible during bull cycles. It emerges during contraction.
The RESCUE Framework
R - Ratio Check (the 35% rule)
In an era of Easy EMI, it is easy to lose track of how much of your salary is already owned by the bank before it even hits your account.
- Your monthly loan repayment repayments (Home, Car, Credit Card, BNPL) should never exceed 35% of your take-home pay.
- Because if you hit 50% or 60%, you are one medical emergency or one “layoff season” away from a total financial collapse. If you’re over 35% right now, stop taking new credit until the old ones are cleared.
E - Emergency Buffer
Many Indians now think, “Why keep cash in a bank at 3% when the stock market gives 18%. This is a trap. You cannot pay a hospital bill with “units” of a mutual fund that might be down 10% that week.
- Keep 6 months of your essential expenses (Rent, Food, EMIs, Insurance) in a simple Savings Account or a Liquid Fund
- This money is not for “investing”. It is for sleeping better at night. Touch it only if you lose your job or face a health crisis.
S - Sinking Funds
Instead of “Buy Now, Pay Later”, go back to “Save Now, Buy Later”. A sinking fund is just a separate pot of money for a specific future expense.
- Want a ₹1.2 Lakh iPhone? Instead of a ₹10,000 EMI for a year (plus interest/processing fees), put ₹10,000 into a recurring deposit for 12 months.
- You earn interest instead of paying it. If you can’t discipline yourself to save the money beforehand, you definitely shouldn’t be trusted to pay it back afterward.
C - Core vs Satellite
Divide your investments into two district buckets.
- The Core (70%): This is the boring stuff; PF, PPF, Index Funds, and Gold. This is for your retirement and your children’s education. Don’t touch it to buy a car.
- The Satellite (30%): This is your “Exciting” stuff. Mid-caps, Small-caps, or Individual stocks. If this bucket crashes, your life doesn’t change; you just don’t get a luxury upgrade this year.
U - Unsubscribe
The biggest enemy of savings in 2026 is convenience. When your credit card is saved on every app and UPI is one fingerprint away, spending is too easy.
- Delete your saved card details from shopping apps. Unsubscribe from “Sale” newsletters.
- If you have to manually type in 16 digits every time you want to buy something, you give your brain 60 seconds to ask: “Do I actually need this, or am I just bored?”
E - Equity for Growth, Debt for Peace
Stop treating the stock market like a bank account and stop treating debt like “free money”.
Equity: Use this only for goals that are 5+ years away. It is a wealth-builder, not a pocket-money generator.
Debt (Loans): Use it only for appreciating assets (like a home). If you are taking a loan for something that loses value the moment you use it (phones, clothes, vacations), you are becoming poorer to look richer.
Sources:
Primary Economic Data
- Net Financial Savings (5.2% - 6.0% of GDP):
RBI Monthly Bulletin (August 2025) and Economic Survey 2025-26.
- Household Liabilities (4.7% - 6.6% of GDP):
RBI Financial Stability Report (December 2025).
- Private Final Consumption Expenditure (61.5% of GDP):
Economic Survey 2025-26 (First Advance Estimates).
Credit & Debt Trends
- Retail Credit Growth (18% of GDP):
Motilal Oswal Report (April 2025) & RBI Credit offtake data (January 2026).
- Unsecured Loan Expansion:
RBI Financial Stability Report (December 2025).
Real Estate & Demographics
- Homebuyer Age Shift (Early 30s):
Anarock Capital / MagicBricks Research (September 2025).
- Demographic Profile:
National Commission on Population / Ministry of Statistics.